Ingest and enrich logs with GeoIP information (country, city, latitude, longitude)


There was a situation where I wanted to know from which country or region people were using a service to adjust the marketing strategy. At the same time it was a requirement to not use Google Analytics or other tracking technology to get this data because of anti-cookie requirements. I also needed a dashboard to visualise the locations.
So what do we do in this case? I came up with the following solution:
- make use of the web server application logs (usually Nginx or Traefik but Apache HTTP Server in this case), transform that data and
- use a pipeline of Promtail, Loki and Grafana to visualise the data.
Step 1 - data extraction and transformation
I looked for an existing solution for step 1 for quite some time but couldn't come up with anything meaningful. Python to the rescue!
All the log lines had to be processed quickly. I came up with a caching solution to process each line just once. For getting the geo information for an IP address, I'm making use of the MaxMind GeoIP database. For frequent running, I chose crontab to execute the script although a systemd process might be a better fit.
Anyway, the logs-with-geo project was born and transformed the data exactly the way I needed it:
 ronnyworm
It's basically spitting out a copy of the original log file except that it also contains the geo information where possible. This could then be used for step 2.
Step 2 - data visualisation
Grafana offers great options to visualise geo data. From individual markers to heat maps to custom maps. But wait a moment, it's not that simple in the beginning.
First, the logs of that new log file from step 1 need to be opened in the explore view and added to a dashboard. There it's possible to select this type of visualisation but it won't accept it out of the box.
I added this pattern to the query <> - - <> country:"" city:"" lat: lng: along with two transform data steps:
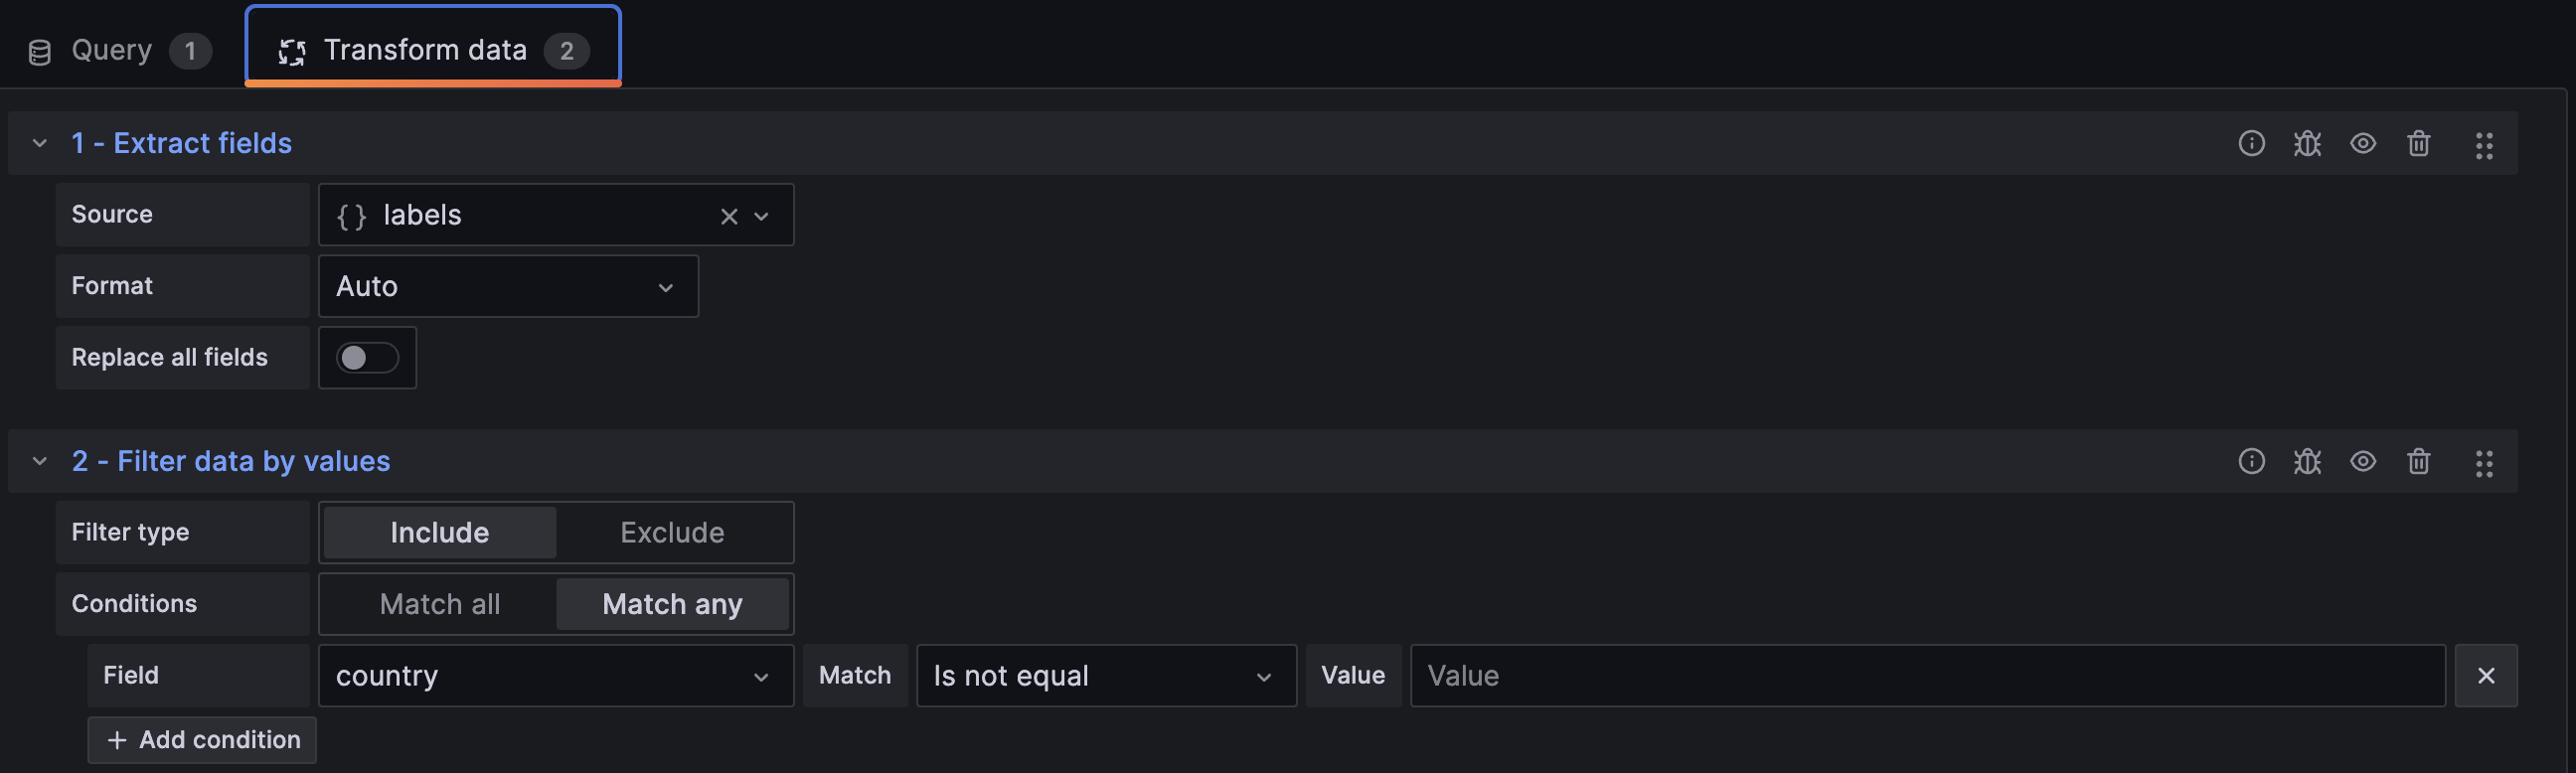
The first lets Grafana understand the format of the lines and the second is for ignoring empty data. Otherwise it's displaying markers at (0,0) when the IP couldn't be resolved.
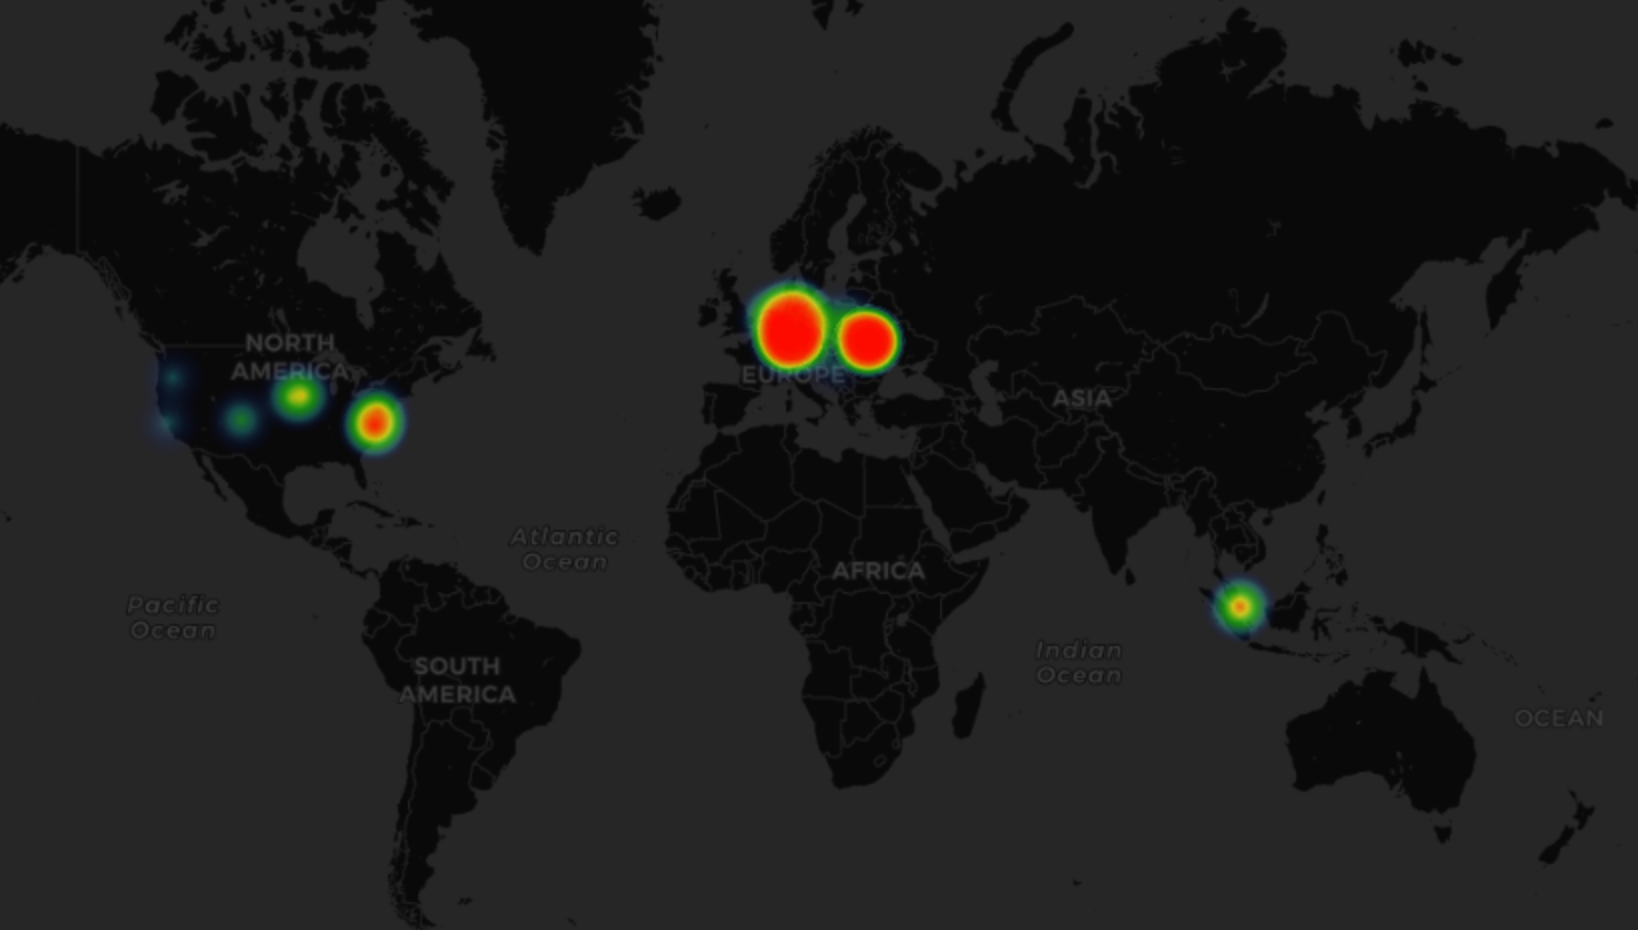
Then in the Geomap visualisation type, in the Map layers I select Query: A for the Data field and boom — it's using the lat and lng fields of the log lines to display the correct markers or heat map in this case.
There we go: user location without any cookies or analytics tools!
How would you implement the mentioned requirements? Do you have any ideas for improvement? Thanks for reading.